Effective Siren System Design
Acoustic Prediction of Emergency Warning Siren System Performance
Emergency Warning Siren design relies on understanding how sound interacts with its given surround environment. Common factors affecting sound propagation are: hemispherical wave divergence; atmospheric absorption; vegetation, trees, and ground effects; wind shadows; and barrier attenuation. All are considered in the ATI model.
Sound attenuation due to hemispherical divergence is uniform in all directions from the siren, at a rate of 6 dB for each doubling of the distance.
Molecular (atmospheric) absorption of sound energy is highly dependent on the temperature and relative humidity of the air, and is quite pronounced at large distances and high frequencies. To avoid over or under design of the system, average atmospheric conditions are used.
Ground attenuation is a function of the topography and covering of the ground, and of the heights of the siren and the receiver. Sound travels to a receiver over two paths:
- Direct line-of-sigh (primary path of outdoor propagation)
- Ground reflected
The sound attenuation along both paths varies with the type and amount of ground cover. The amount of sound attenuation along the ground-reflected path also depends on whether the ground cover is absorptive or reflective.
Wind shadows are caused by the gradients in wind speed. Gradients near the ground nearly always are positive, that is, the wind speed increases with height. As a result, a shadow zone (an area of reduced sound level) is commonly encountered upwind from the siren where the wind gradient bends the sound rays upward. Downwind, the sound rays are bent downward, hence no shadow zone is produced.
Barrier attenuation is reduction ‘in sound level within the shadow zone of a barrier to the passage of sound waves, such as a mound of earth, a hill, or a large structure.
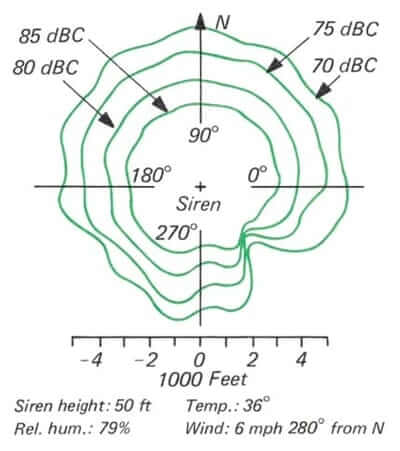
Figure 2 shows a sound level contour plot. The sound level data for each siren location is generated by ATI’s computer model in graphical format.
For the ideal case with identical meteorological, topographical, and ground cover conditions in all directions from the siren, the sound level contours would be perfect circles. Deviations from a circle are due to variations in topography and ground cover.
Figure 2 shows the attenuating effects of a large hill southwest of the siren and a sharp rise in ground elevation southeast of the siren.
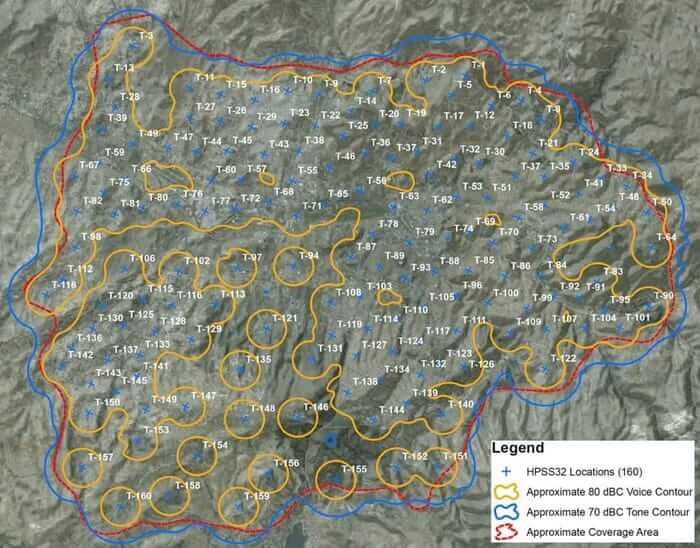
Tentative siren locations are selected on the basis of power line locations to eliminate the cost of extending power lines over great distances. Several computer iterations are made to determine the optimum number and locations of sirens.
Siren Performance Verification
Once the siren system is in operation, measurements can be taken in the field to determine its actual acoustic performance.
Measurements are taken for maximum and minimum siren sound levels. Descriptions of the measurement locations and nearby noise sources are recorded to aid in the analysis and processing of the data.
It is crucial to have a record of the ambient noise level for assessing the capability of the alerting system because the effectiveness of the siren sound can be reduced greatly by high noise levels due to heavy traffic, construction, or other non-transient sources.
For the purpose of comparing the measured sound levels with the predicted levels, an hourly report of the ambient temperatures, relative humidity, and wind condition was obtained from the National Weather Service Office in Rochester.
To determine the exact propagation frequencies of the sirens, a real-time narrow band frequency analysis was conducted.
Figure 4 shows the contribution of various siren tones in the frequency range of 0-2000 Hz for the steady alert signal of the typical dual-tone rotating model, rated at 125 dB at 100 ft.
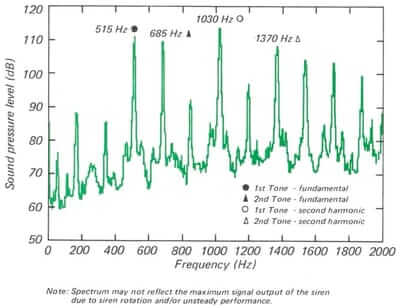
Measurements were made at ground level 25 ft from siren pole.
Sound propagation is a function of the signal frequency. As frequency increases, so does atmospheric propagation loss. Therefore, the fundamental of the first tone is the dominant frequency at larger distances. Since. the higher frequency tones are attenuated much faster with distance than low frequency tones, the influence of the higher frequency tones is significant only near the siren.
Test Results vs Predicted Values
To compare the measured results with the analytical predictions, a statistical analysis of the differences between the two was performed.
A histogram of the arithmetic differences between measured and predicted sound pressure levels (SPL) of all sirens is shown in Figure 5.
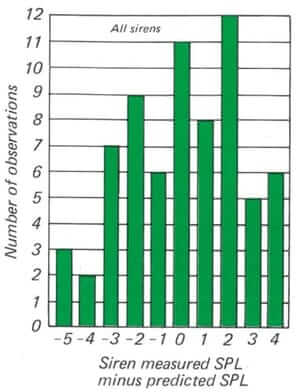
The arithmetic average of the entire number of observations of differences between the predicted and the measured sound levels was calculated to be 0.04 dB.
To illustrate the degree of data fluctuation around the mean, the standard deviation was used. The standard deviation from this average difference was computed to be ± 2.43 dB. These values are useful in determining both the accuracy and the precision of the analytical results.
As the average difference is much less than the precision of measurement (± 1 dB), the computer predictions have a high level of accuracy, giving SPL values which are neither too conservative nor too liberal. The standard deviation shows that the analytical methods correlate excellently with test results within a range of approximately 2.5 dB.